 |
| |
 |
| |
MEi Provides Assistance in Arson Investigations
How to Read EDS Spectra
MEi
Involved in Local ASM Chapter
MEi Speaks at
CASMI Meeting
708, 312, 847, 815, 630 BINGO! |

 Arson
brings up images of a shady character with a gas can in an old warehouse.
While the felonious crime of Arson has become more sophisticated,
the purpose remains the same: to destroy property for gain by purposely
setting a fire. Arson
brings up images of a shady character with a gas can in an old warehouse.
While the felonious crime of Arson has become more sophisticated,
the purpose remains the same: to destroy property for gain by purposely
setting a fire.
The investigation....
The fire investigator
makes a thorough examination of the fire site, often immediately after
the fire. Through this examination, investigators can determine the
location in which the fire initiated. From the evidence, the cause
can usually be determined, as well as if the fire was arson or accidental.
The problem...
Many different
incendiary devices are constantly being created in order to mislead
fire investigators into thinking the fire is due to natural causes.
Thanks to skilled fire investigators, experience and technological
advances, the mystery of these devices and how they work is soon understood
and exposed.
The device...
In recent years
the use of thermite reactions as incendiary devices has gained popularity
with arsonists because they are easily ignited with a match, burn
quickly and can generate a very intense heat in excess of 4000(F.
These substances are a mixture of copper oxide powders and other chemicals
which can be home made or purchased commercially as products used
for welding large copper bus bars together.
The
clue...
When thermite reaction
compounds are used to ignite a fire, they produce a characteristic
burn pattern, and leave behind evidence. These compounds are rather
unique in their chemical composition, containing common elements such
as copper, iron, calcium, silicon and aluminum, but also contain more
unusual elements, such as vanadium, titanium, tin, fluorine and manganese.
While some of these elements are consumed in the fire, many are also
left behind in the residue.
The technology...
MEi has conducted
Energy Dispersive Spectroscopy (EDS) on minute traces of residue,
identifying the presence of these chemical elements. The results,
coupled with visual evidence at the scene, provide absolute certainty
that thermite reaction compounds were present, indicating the fire
was deliberately set, and not of natural causes.
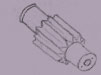
The photographs show a copper gas line where thermite reaction compounds
were placed by an arsonist, causing a fire and destroying a house.
EDS analysis of these samples identified the presence of chemical
elements and was a key piece of evidence in determining that the fire
was not an accident, but was deliberately set.
Our
experience...
Materials Engineering,
Inc., has a great deal of experience working with many insurance and
fire investigators. These include registered Professional Engineers
and registered Private Investigators who have been trained and educated
in the field of fire investigation. Many have specialized in specific
areas of fire investigation, such as Electrical Engineers with expertise
in electrically initiated fires. Some of the investigators we work
with have taught classes to Police and Fire departments.
We have supported fire investigations with numerous laboratory tasks,
including identification of chemicals present, analysis of electrical
arcing, determining exposure temperature by looking for microstructural
changes in metals or by knowledge of melting points. These tasks have
helped fire investigators to determine if damage is the cause of a
fire, or has been caused by the fire.
While we are involved in a wide range of industrial, legal and insurance
projects, few offer the satisfaction of supporting an arson investigation.
EDS
is a powerful tool in identifying chemical elements in residues, particles,
inclusions, corrosion products and filtrates, even if only a minute
quantity is present. Contamination identification is one of the major
services we provide to industry. However, we often receive phone calls
from customers who need a little help in understanding exactly what
'that strange chart attached to the report' is. This article will
provide an overview of EDS analysis.
A
little physics for background...(skip this paragraph is you don't
remember your physics)
In the scanning electron microscope (SEM), the sample is bombarded
with electrons. Most of these electrons collide with and therefore
interact with the orbital electrons in the atoms (remember the s,
p,, d and f orbitals). Some of these electrons gain enough energy
from the collisions to become free from their orbital. When this happens,
it leaves a 'hole' on the atoms' orbital. An electron from an outer
shell will jump down to the lower shell to fill the hole. This jump
represents a change in energy for the electron, and so it releases
an x-ray. This energy level of this x-ray is unique to the atom and
is exactly the difference between the energy level of the orbitals.
By measuring the energy level of this x-ray, the atom (or chemical
element) can be. This is how EDS works.
The
EDS spectrum is a plot of energy level on the horizontal axis and
counts on the vertical axis. As atoms have many different electrons
that can jump between the levels, a single element has an EDS spectrum
of a series of peaks, representing the jumps between the various orbital
electrons. These peaks are often called the K, L, and M peaks, referring
to which electron orbital shells they represent.
Bigger
(higher atomic number elements) atoms have higher energy levels, and
will generally appear on the right side of the plot. These include
iron, copper, nickel, and chromium. Smaller atoms (lower atomic number
elements) have lower energy levels and will generally appear on the
left side of the plot. These include chlorine, silicon, aluminum and
carbon. The peaks will always be located at the same energy levels
on the horizontal axis.
Many
of the peaks do overlap so a skilled operator will insure that he
has correctly identified an element by looking for the second and
third peaks for each element.
While
all elements will show more than one peak, if the concentration is
low, multiple peaks may not be visible on the spectrum. Likewise,
elements with very low atomic number, (carbon, oxygen) typically show
only one peak. Most commercially available EDS analysis equipment
has software which assist the user in identifying and the peaks.
The first figure
shows a typical EDS spectrum for a stainless steel, with peaks for
iron, chromium, nickel and silicon. Notice that all the peaks are
not the same height. This is due to higher concentrations of iron
than chromium or nickel in stainless steel. However, the height is
not always an exact measurement of concentration. Other variables
in the atoms and the SEM affect peak height. EDS equipment takes into
account these factors and can be used to calculated quantitative amounts
of the elements.
A
typical application of EDS is to identify the contamination on the
surface of a metal. While examining the sample in the SEM, we 'align
the crossbars' on the contamination and generate an EDS spectrum.
However, and the contaminant is small, the electron beam penetrates
through it into the base metal. Therefore, the spectrum shows the
elements present in the contamination and the base metal. You must
mentally subtract out the base metal elements to know what is in the
contamination. This is why we will usually publish base metal spectrum
for comparison.
The
second spectrum is of a residue on a stainless steel component. As
you can see, many peaks are present. By subtracting iron, chromium,
nickel and silicon found in the first spectrum, the contamination
can be identified as containing mostly chlorine, with lesser amounts
of sodium and potassium and a trace of sulfur. Summary of EDS spectra
interpretation
1
If the peak is present, then the element is present.
2
Peaks for a given element are always located in the same place on
the horizontal axis.
3
Most elements generate more than one peak. This is normal
4
Higher peaks indicate greater concentration, but not this is not linear
5 Quantitative
analysis can provide a weight percent, but use this data with caution.
6 Be sure to subtract
off base metal peaks to find out what is in the contaminant.
7 Call us if you
have any questions about the data in your report.
This
year, Bill Durako is serving as secretary for the Rockford Chapter
of ASM International, and will become Vice Chairman next year. ASM
International, formerly known as the American Society for Metals,
has long been the largest technical society for Materials and Metallurgical
Engineers.
In
this position, he works with the 12 member executive committee in
a variety of chapter activities. One of the major activities is planning
the meetings and arranging speakers. Please give us a call if you
or someone from your company would like to make a technical presentation
at an ASM meeting. We are always looking for interesting materials
related topics and good speakers.
MEi,
along with Charles Kawin Company, sponsored a TV give away as an attendance
prize at this year's monthly ASM meetings. By sponsoring such activities,
we hope to encourage members to become more involved in the ASM chapter.
We are open to consider sponsoring a similar activity with your technical
society, so give us a call.
We
enjoy being active in technical societies because they offer a good
opportunity to have technical conversations in a relaxed social environment.
Through the years, the staff at Materials Engineering has been involved
in ASTM, NSPE, ASME, SAMPE, TMS-AIME, ACerS, SAE, and ASM. We hope
to see you there!
We
have an open offer to any of our customers and friends to prepare
a presentation for your local technical society meeting. Just give
us a call, we'll be glad to do it.
Last
November, Bill Durako spoke to a full house of members and guests
of the Chicago Area Spring Manufactures Institute (CASMI) meeting.
The meeting was one of the best attended CASMI meetings of the year,
with nearly sixty people present.
The
title of the presentation was "Why Do Springs and Things Fail?",
covering the subject of failure analysis in general, with the majority
of the talk citing examples involving springs. Materials Engineering
has looked at many springs through the years, dealing with failure
analysis, processing problems, design issues, plating problems, hydrogen
embrittlement, heat treating and corrosion issues.
It
is time once again to play area code bingo. With large increases in
phone lines for computers and cellular phones, Ma Bell has let it
be known that the 708 area code will soon be filled up, requiring
new areas codes (and mass confusion). I am sure this is not news to
many of you who are already dealing with these changes.
Unfortunately,
MEi is not immune to these changes. As of August 3, 1996, we will
change to area code 630. To permit a smooth transition, we will be
sending out a reminder to all of our customers as the time of change
approaches. |
 Next:
1996 Fall Newsletter Next:
1996 Fall Newsletter |
| |
|
|
|
|
